48
LNG
INDUSTRY
APRIL
2016
Along the whole LNG chain – during production,
transportation and regasification – BOG is constantly evaporating
from the LNG, which is bunkered in storage tanks at cryogenic
temperatures and atmospheric pressure. According to its nature,
the BOG flow profile differs along the different steps of the value
chain, thus the requirements on BOG compression also differ.
BOG generation during LNG carrier transportation, while
constant, is rather small. For LNG export plants and LNG import
terminals, the maximumBOG volume flow is much greater and
faces large fluctuations. This is due to the impact of increased
heat leakage during ship loading (export plant) and ship
unloading (import terminal).
In LNG export plants, the BOG generation rate is the highest
along the LNG chain and the BOG flow undergoes large volume
fluctuations defined in two major plant operating modes.
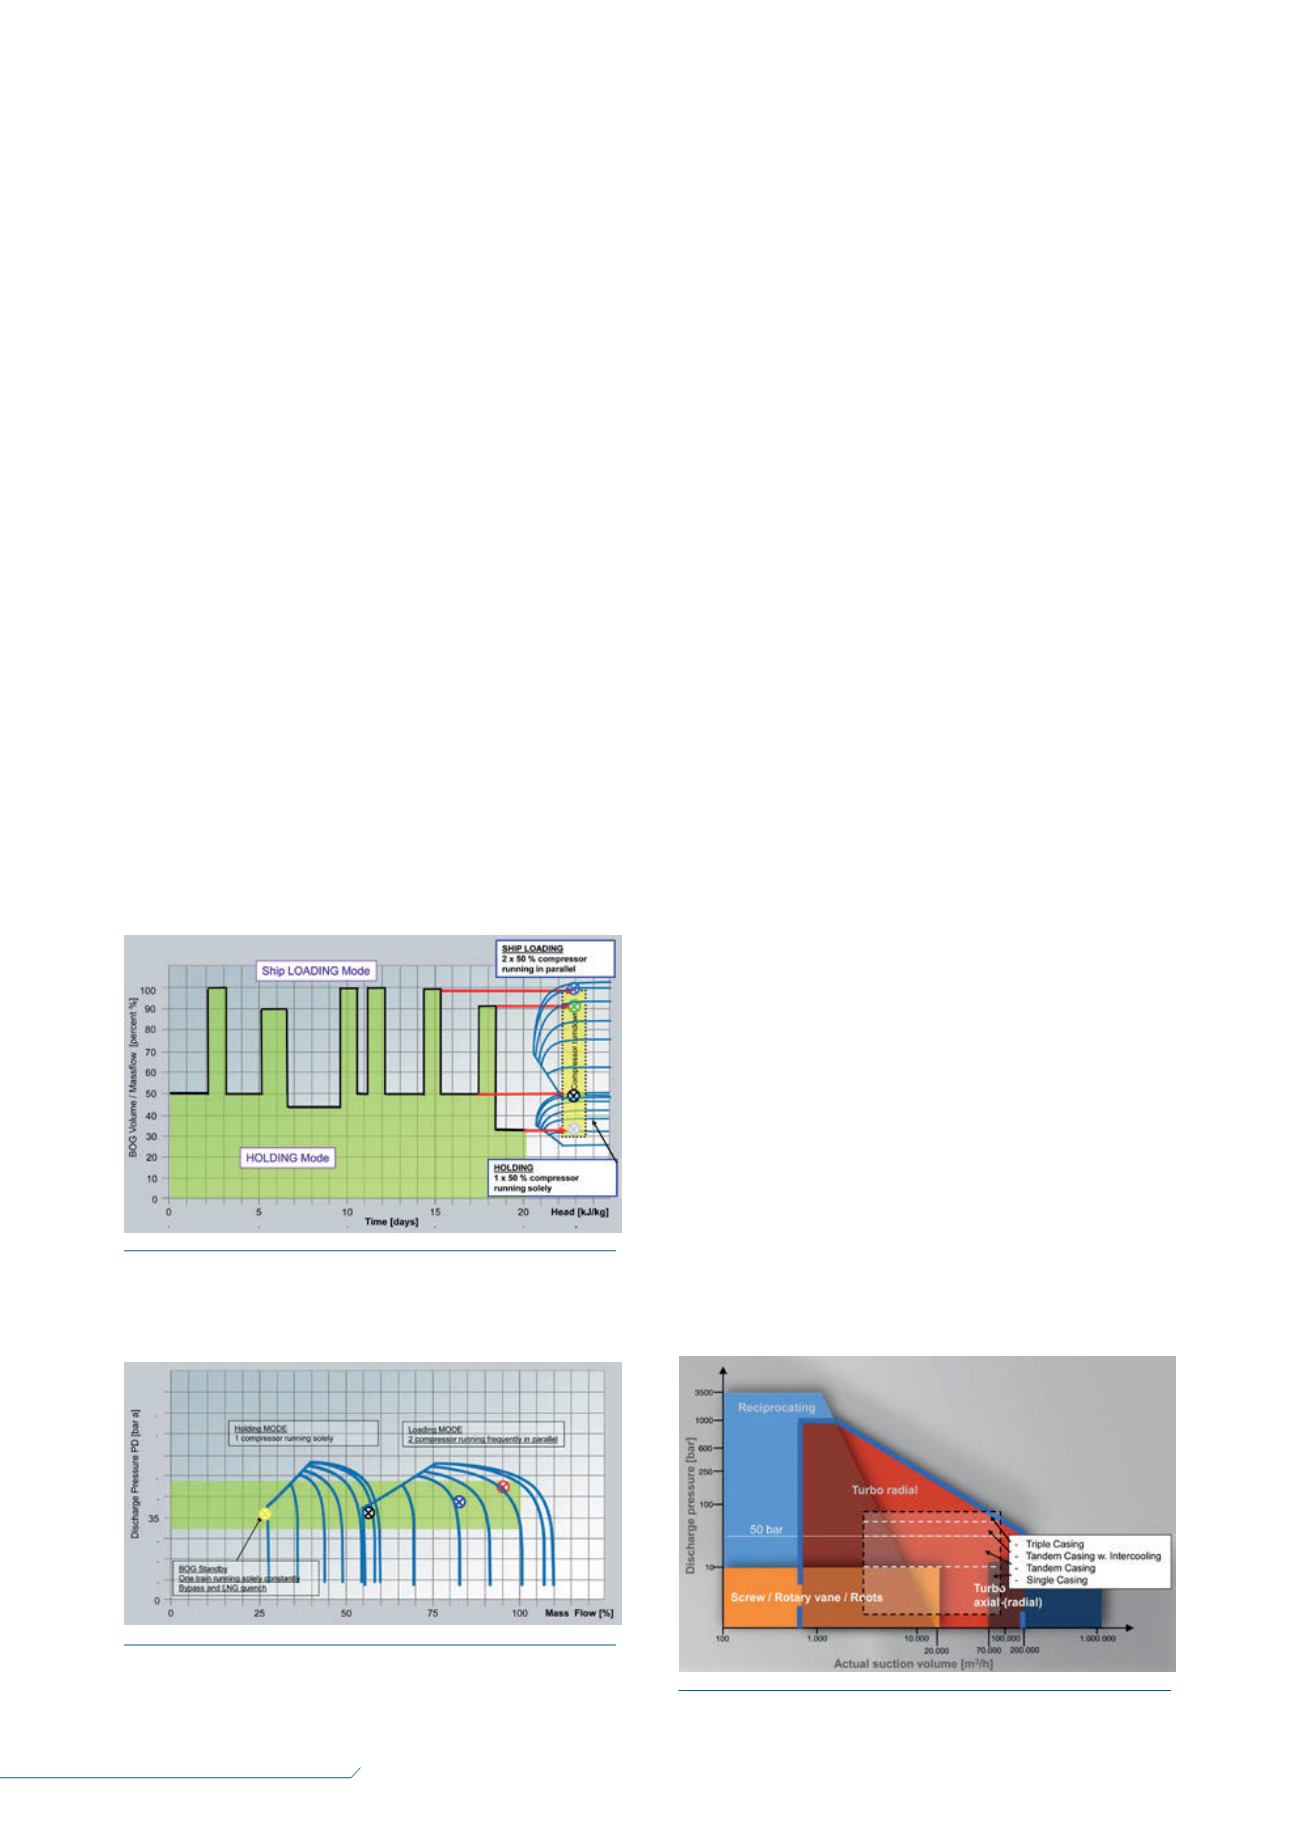
Figure 1 shows the project-specific LNG BOG/end flash gas
(EFG) generation profile over time with one almost constant BOG
and EFG flow called ‘holding’ and a characteristic peak in BOG
volume flow during ship loading.
The different BOG volume flows are caused by different heat
leakage sources. In the holding (BOG/EFG) example, onshore
LNG tank heat leakage and the flash effect from LNG production
(main cryogenic heat exchanger pressure flashed down to
storage pressure) are the key sources of heat leakage.
In the ship loading example, heat leakage comes from the six
submerged LNG pumps (approximately 1 – 2 MWeach), the jetty
piping and the LNG ship cargo.
On the right side of Figure 1, the 2 x 50%overlapping BOG
compressor performance maps have been flipped with different
inlet guide vane (IGV) settings. The holding operating point (blue
dot) is basically the main operating point and for that reason
should run at good efficiency and without any bypass flow and
LNG quench.
In Figure 2, the ship loading operating point (red dot)
represents the peak volume flow, which occurs frequently and is
covered by starting another BOG compressor train. The graphic
also shows a BOG flowrate of 2 x 50 tph, which equals a 100%
mass flow – a usual value for today’s typical LNG plant.
By serving the flow requirement with either one or two trains,
all operating points are covered with a single-casing BOG
compressor.
Some loading operating points, especially at the beginning of
the new loading cycle, temporarily increase the BOG temperature
above the design point ranging from approximately -145°C
(-229°F) down to -160°C (-256°F). Thus, volume flow increases
and outlet pressure decreases.
Allowing minor LNG quench of approximately 3 – 5% for the
initial loading operating point would provide a more compact
compressor that can be maintained while featuring a 2 x 50%
solution instead of a 3 x 33% arrangement. By this measure,
recycle flow can be minimised, or even prevented, while outlet
pressure can be maintained.
All specified operating duties can be covered with two
identical tandem-casing BOG single-shaft centrifugal compressor
trains. This solution for process optimisation would ensure
minimum equipment count and the lowest installation volume,
while still maintaining maximum operating reliability, availability
and safety.
In LNG plants, the BOG, together with the EFG coming from
the flash drum, is often used as fuel for gas turbines. Thus, the
fuel gas pressure required by the turbine significantly affects the
required BOG compressor concept. Despite inherent flow
fluctuations, the BOG package needs to deliver the flow at a
specified pressure to satisfy the fuel gas pressure requirement for
the gas turbines in the facility.
Depending on the different fuel gas pressure requirements,
single, tandem, or even triple-casing BOG compressors may be
required (Figure 3).
An unconventional arrangement
for LNG import terminals
In LNG import terminals (onshore or offshore), there are two
major operating modes – holding mode and unloading mode –
which determine the BOG duties.
Figure 2.
Using the 2 x 50% BOG compressor model from
Figure 1, the predicted compressor performance can be mapped
out, inlcuding the peak volume flow of the BOG compressor.
Figure 3.
The application range of different compressor types.
Figure 1.
A boil-off gas (BOG) generation profile (2 x 50%
BOG compressor concept) at an LNG export plant showing the
flow fluctuation between the holding and loading modes.


