


 40 / 60

38
January 2020
focusing on the key elements within the chain. This article
specifically focuses on the LNG liquefaction facility. GHG
mitigation measures are compared and discussed by
considering a realistic LNG facility case study, identifying the
steps required to reduce GHG emissions. This approach
demonstrates how a project could be configured to meet
stringent GHG emissions targets.
GHG emission sources
To effectively target the right carbon reduction measures, the
emitters must first be identified and then assessed to what
degree they impact the overall emissions.
Carbon dioxide (CO
2
) in the feed gas is one source. For
high CO
2
field developments, this has a significant impact on
GHG emissions. For all liquefaction processes, the CO
2
in
feed gas must be removed to a strict specification to prevent
cryogenic freezing, and is typically removed with amine
before being released into the atmosphere. Rather than
releasing CO
2
into the atmosphere, some facilities with high
CO
2
content reinject it back into a reservoir. This is often
seen as the initial step in reducing emissions from these
developments. This is the case for both Hammerfest LNG and
more recently Gorgon LNG.
A second, and major, CO
2
emitter is the liquefaction
process, as it requires huge amounts of energy to drive the
refrigerant compressors. This energy typically derives from
burning fuel gas in gas turbines resulting in high CO
2
emissions. Some facilities use electric motors to drive the
compressors instead of gas turbines, with the electric power
being delivered from a low CO
2
emissions source.
Hammerfest LNG was the first baseload LNG plant with
electric drives, but more recently Freeport LNG also adopted
this approach. Future projects, such as Kitimat LNG, are also
exploring an e-drive solution with power imported from
hydroelectric sources.
Auxiliary power generation is another CO
2
emitter for
consideration. The majority of facilities generate this power
through the use of gas turbines. However, some projects,
such as Canada LNG, are considering importing auxiliary
power from a renewable power source as a means of
reducing emissions.
GHG emissions reduction
measures
These key CO
2
emitters are where emission reducing
measures need to be applied. Existing LNG plants have
varying GHG emissions for these sources and some facilities
can be as high as 0.46 t of CO
2
equivalent per tonne of
LNG (tCO
2
e/tLNG). By focusing on a case study, it can be
observed how the GHG emissions are affected by various
GHG emission reduction measures. For this evaluation, a
tight GHG emissions limit of 0.16 tCO
2
e/tLNG is targeted, in
line with the regulations of British Columbia, Canada. The
measures for consideration are grouped into four categories:
electrification; efficiency enhancements; technology
advancements; and carbon capture.
The case study
The case study consists of an onshore liquefaction facility
operating with conditions similar to those observed in
Canada – a region of the world where there is considerable
LNG activity with numerous projects expected to reach a
final investment decision (FID).
The key parameters include the following:
z
Feed gas composition (CO
2
, nitrogen, hydrogen sulfide
and methane being <0.7, 0.7, 0.5, 90 mol %, respectively,
with the balance being heavier hydrocarbons).
z
An air-cooled facility with 10°C ambient air
temperature.
z
60 barg liquefaction feed gas pressure.
z
Dual mixed refrigerant (DMR) liquefaction technology
consisting of refrigerant compressors driven by
aeroderivatives.
z
Auxiliary power is generated within battery limits by gas
turbine generators operating on fuel gas.
When considering liquefaction technology selection,
many other important factors and criteria are considered in
addition to efficiency, so the benefits of the various
liquefaction technologies and their licensors should be
reviewed in conjunction with any impact on GHG emissions.
This does not form part of this evaluation.
Figure 1.
Floating wind turbine.
Figure 2.
Just Catch™ carbon capture technology.
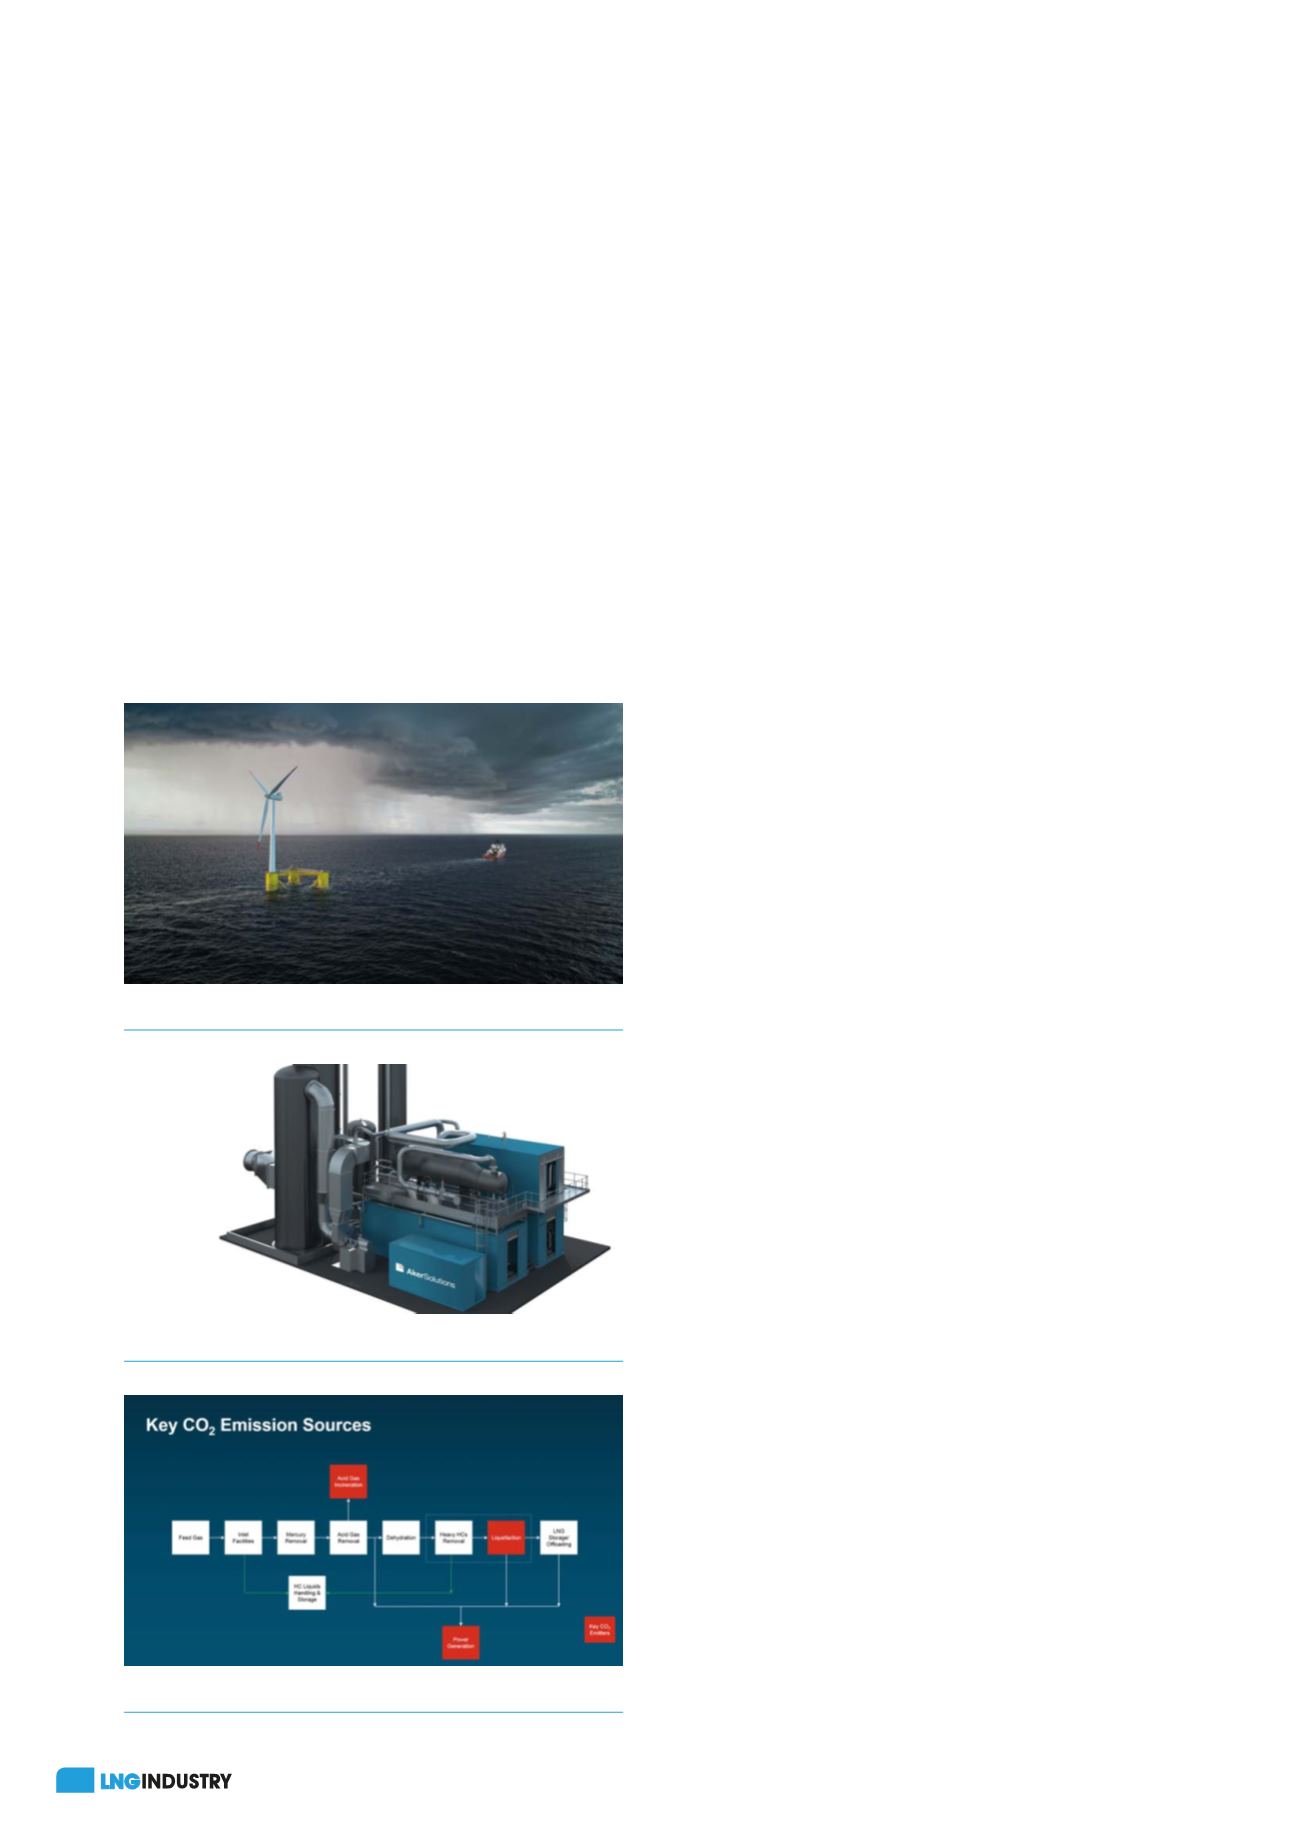
Figure 3.
CO
2
emission sources from LNG trains.