106
LNG
INDUSTRY
MARCH
2016
compressor trains and blowers driven by motors or steam
turbines. On such machines, the transient conditions can
be brief and the ability to store every waveform, as with
an analogue tape recorder, can be important. Normally,
the system will save no more than one waveform from
each vibration sensor every 2 – 3 sec., and it simply
chooses the most interesting waveform during that
interval. If nothing is interesting, then nothing is saved.
The system, therefore, can go for many minutes or hours
without the need to save anything. However, during fast
starts or stops, the system can be placed into a special
mode in which every single waveform is saved for the
duration of the start-up or shutdown.
Operating experience
Experience gained over the last two years has
demonstrated that a commercial process historian,
namely the OSIsoft PI System, is capable of handling
vibration data without constraining the types of plots,
data resolution, or features that are required by rotating
machinery engineers and vibration analysts. By using
the process historian as the single ‘system of record’
for not just process data, but also for vibration data and
compressor surge/thermodynamic performance data,
the ease of correlating process, vibration, and other
relevant machinery information is greatly facilitated and IT
infrastructure is eliminated (Figure 3). Indeed, the identical
considerations discussed in this article for vibration data
and its special needs can (and are) being extrapolated
to compressor surge/thermodynamic performance data,
so that it too can use the process historian rather than
necessitating a separate ‘silo’ just for its own data.
Vibration data is stored in the process historian as
time series and event records, just as any other process
data, and can be visualised using standard process
historian tools, such as PI ProcessBook (Figure 4). When
users need to access more specialised plot types that are
not native to the process historian, a separate
visualisation tool is used. Its purpose is simply to display
the vibration data resident in the historian that cannot be
presented using standard trends, bar graphs, and other
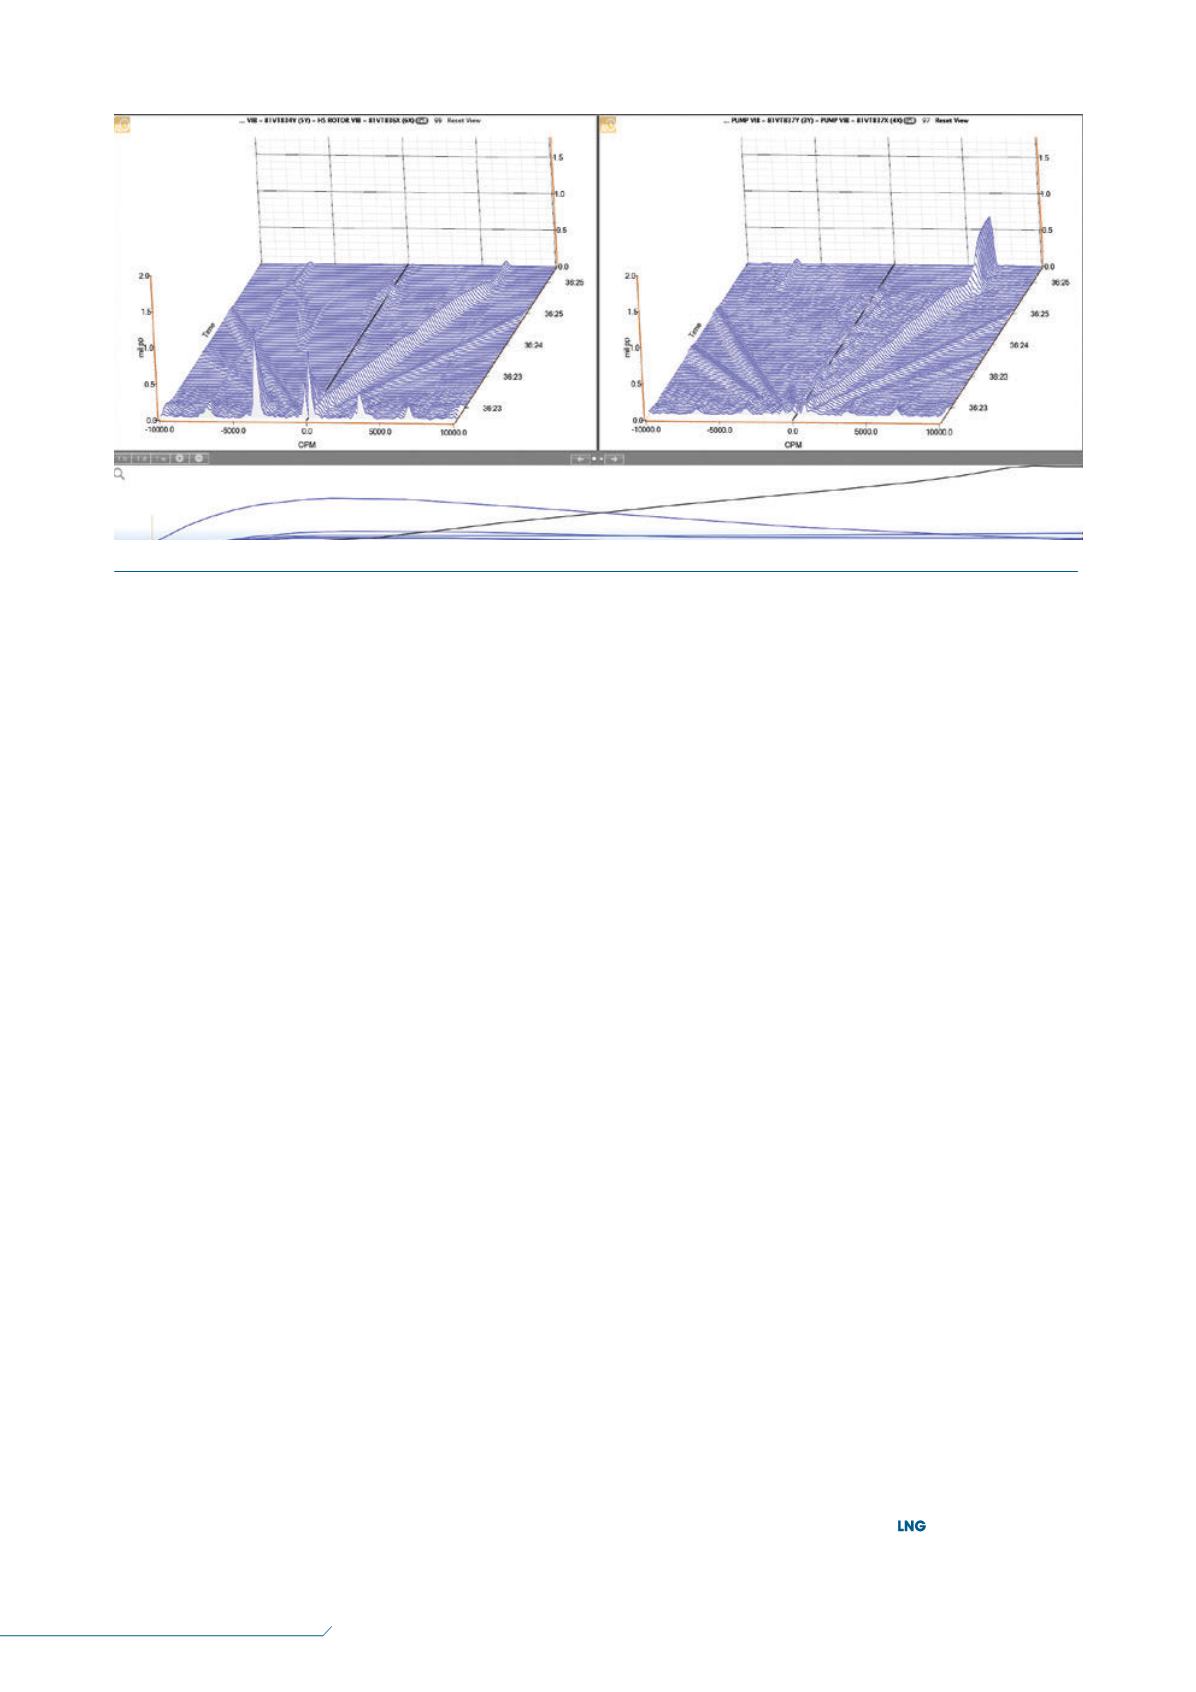
tools native to the historian. Examples of the vibration
visualisation tool are shown in Figures 5 and 6.
The system described here is in use at more than
two dozen sites globally, many of which did not require
the purchase of any additional software as they were
already users of the OSIsoft PI System and had the
requisite number of tags and server capacity to add the
desired vibration data.
Conclusion
The industries in which critical machinery is used, and
in which continuous vibration monitoring is practised,
have conditioned themselves to accept the necessity
of separate databases and tools for each kind of data,
be it process data, vibration data, thermodynamic
performance data, or compressor surge data. The
historical reasons for this have largely been technical
in nature, due to the limitations of process historians.
However, advances in the speed at which the historian
can write data to its database and in the data structures
it uses have removed the impediments to the inclusion
of vibration data, including the extremely high speed
waveform data necessary for machinery engineers and
vibration analysts to perform their jobs. The benefits
of using a single system extend not only to these
individuals, but also to corporate IT departments that
want to standardise and rationalise the number of
software platforms used across the enterprise, while
simultaneously providing high levels of reliability and
security. As the process historian is almost always
considered a ‘mission critical’ application with a broad
base of users and IT support resources, the inclusion
of other types of data, which has previously been
impractical or impossible – such as vibration and surge
data – is now a viable alternative.
Figure 6.
Electric motor driven start-up lasting only 3 sec.


