102
LNG
INDUSTRY
MARCH
2016
fast. In a typical process plant, the Distributed Control
System (DCS) can have tens of thousands of loops to
control and monitor, and the process historian can likewise
have hundreds of thousands of points. In contrast, vibration
systems usually have fewer than 1000 total points across
all of the critical monitoring machinery, but each point
must be updated with millisecond scan rates.
Modern process historians are equally adept at
addressing both of the following situations: a large number
of points at update rates measured in seconds, or a smaller
number of points at update rates measured in milliseconds
or even microseconds. In other words, historians can
address 100 000 points at 10 sec. scan rates as easily as
1000 points at 1 msec. scan rates. In either instance, the
rate at which the historian must acquire and store data
equates to 1 million value per sec.
A fork in the road
The reason that a process historian, such as the PI System,
can be used for vibration data is two-fold. Firstly, a
vibration waveform is nothing more than an exceedingly
fast trend. Instead of data samples separated in time
by seconds, data samples are separated in time by
milliseconds. Both are time series data, and one is simply
faster than the other. Process historians are very good at
handling time series data. Secondly, the PI System had
evolved not just in terms of speed, but in terms of how it
organised measurement points. Measurement points in the
vibration world are organised into ascending hierarchies
starting with points, bearings, machine cases, machine
trains, process units, plants, etc. Thus, a measurement
point might be described as ‘X probe, inboard bearing,
compressor K-101, refrigeration train, plant 2’. In the case
of the PI System, it had recently been enhanced to allow
measurement points (or ‘tags’) to be organised in terms of
such hierarchies. Therefore, it could handle both the data
structures required and the data speeds required.
It is precisely these capabilities that made the
PI System viable for high speed vibration data, allowing the
process historian and vibration historian to converge into a
single infrastructure, without the need of proprietary
vibration servers and networks.
Deadbands for waveforms
One of the inherent challenges in the collection of any type
of data, and particularly with vibration waveform data,
is that it is undesirable to store everything. This is partly
because of the storage space required to save everything
and network bandwidths needed to move everything,
Figure 3.
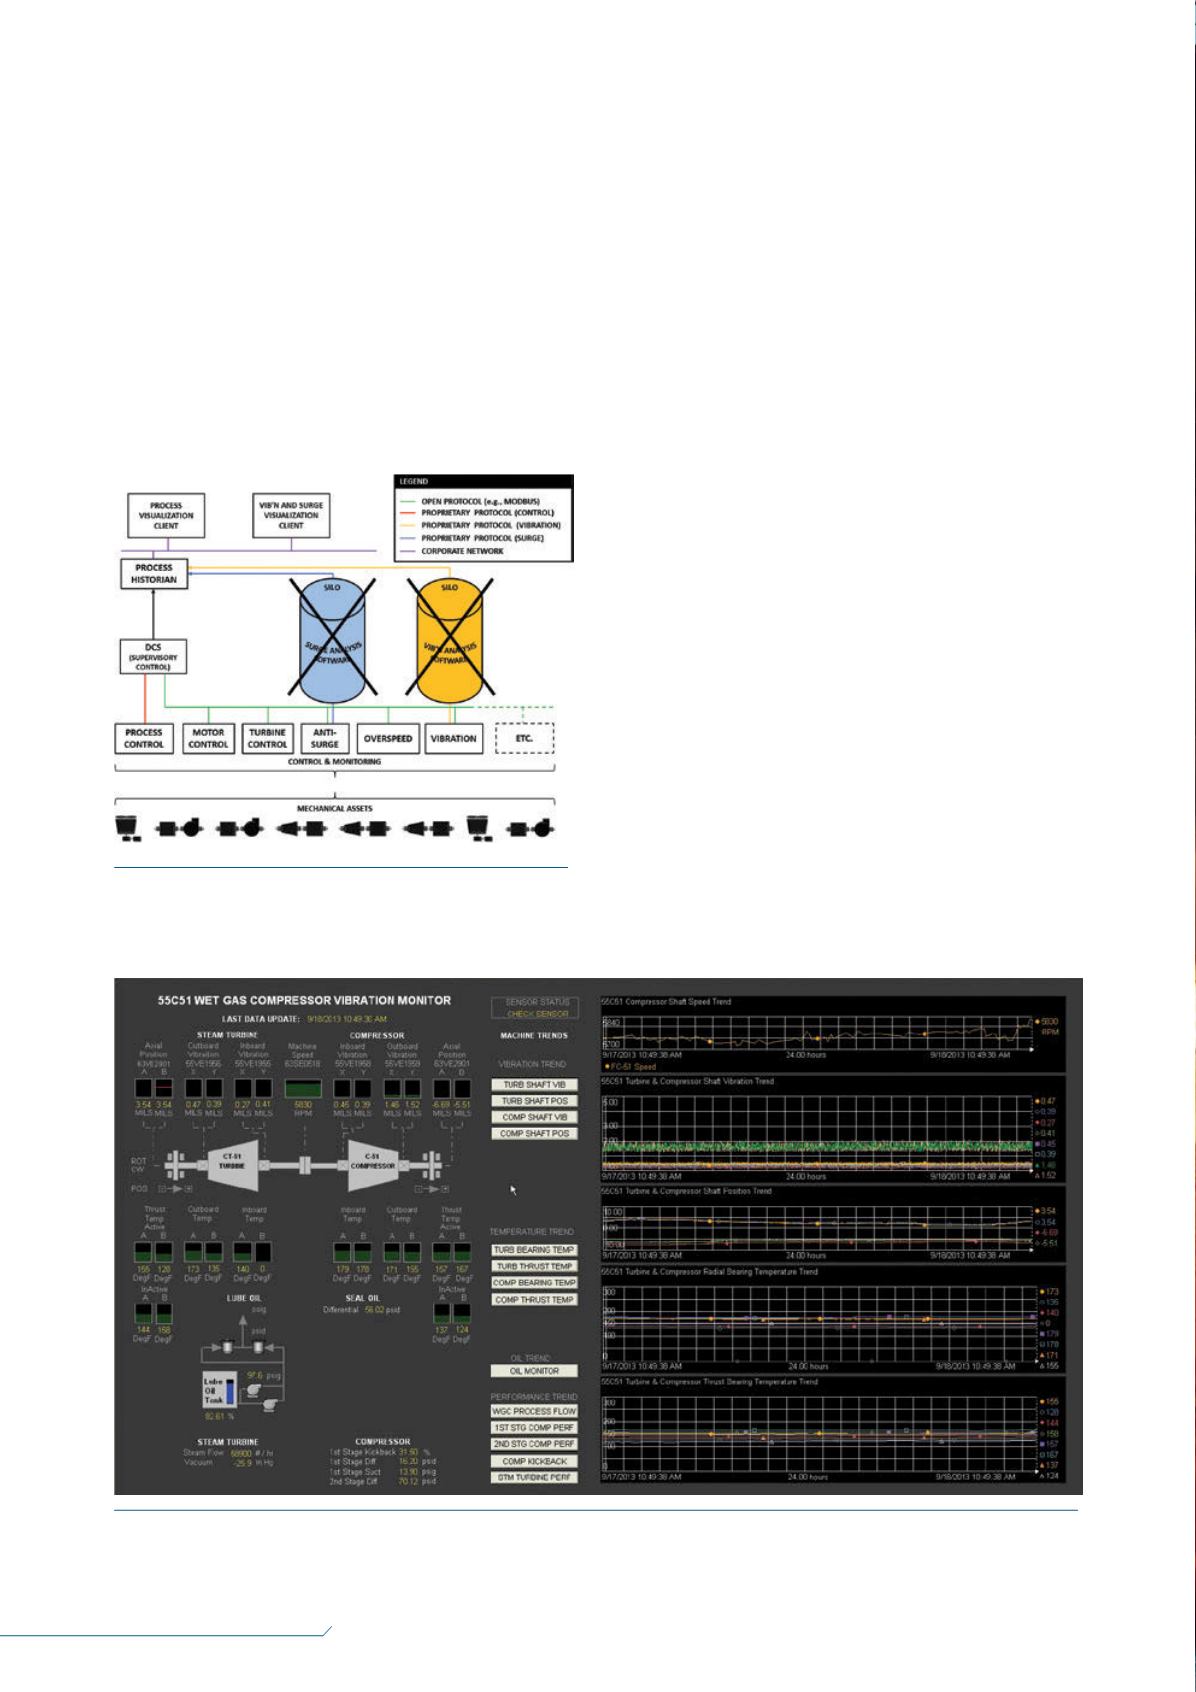
By using the process historian, the need for
separate silos can be eliminated. This approach is available
not just for vibration data, but also for compressor
surge/thermodynamic performance data as well.
Figure 4.
Typical screen for a turbine driven compressor train built by a customer using PI ProcessBook. When trend and
status information beyond the capabilities of ProcessBook are required, the user can use the buttons on this screen to launch the
specialised visualisation tools, such as the one shown in Figures 5 and 6.


