18
LNG
INDUSTRY
MARCH
2016
requirements for a large section of the FLNG facility and
will have a great impact on the overall vessel design.
There are a number of liquefaction process cycles that
are suitable for FLNG application.
1
These include the
AP-SMR
TM
single mixed refrigerant process, the AP-DMR
TM
dual mixed refrigerant process and the AP-N
TM
nitrogen
recycle process. Some key features of these processes are
summarised in Table 1. The AP-SMR and AP-DMR
processes utilise hydrocarbon refrigerants and have been
presented previously in
LNG Industry
.
2
Comparing liquefaction
processes: cooling curves
Process engineers often use cooling curves as one
measure to optimise and compare liquefaction processes.
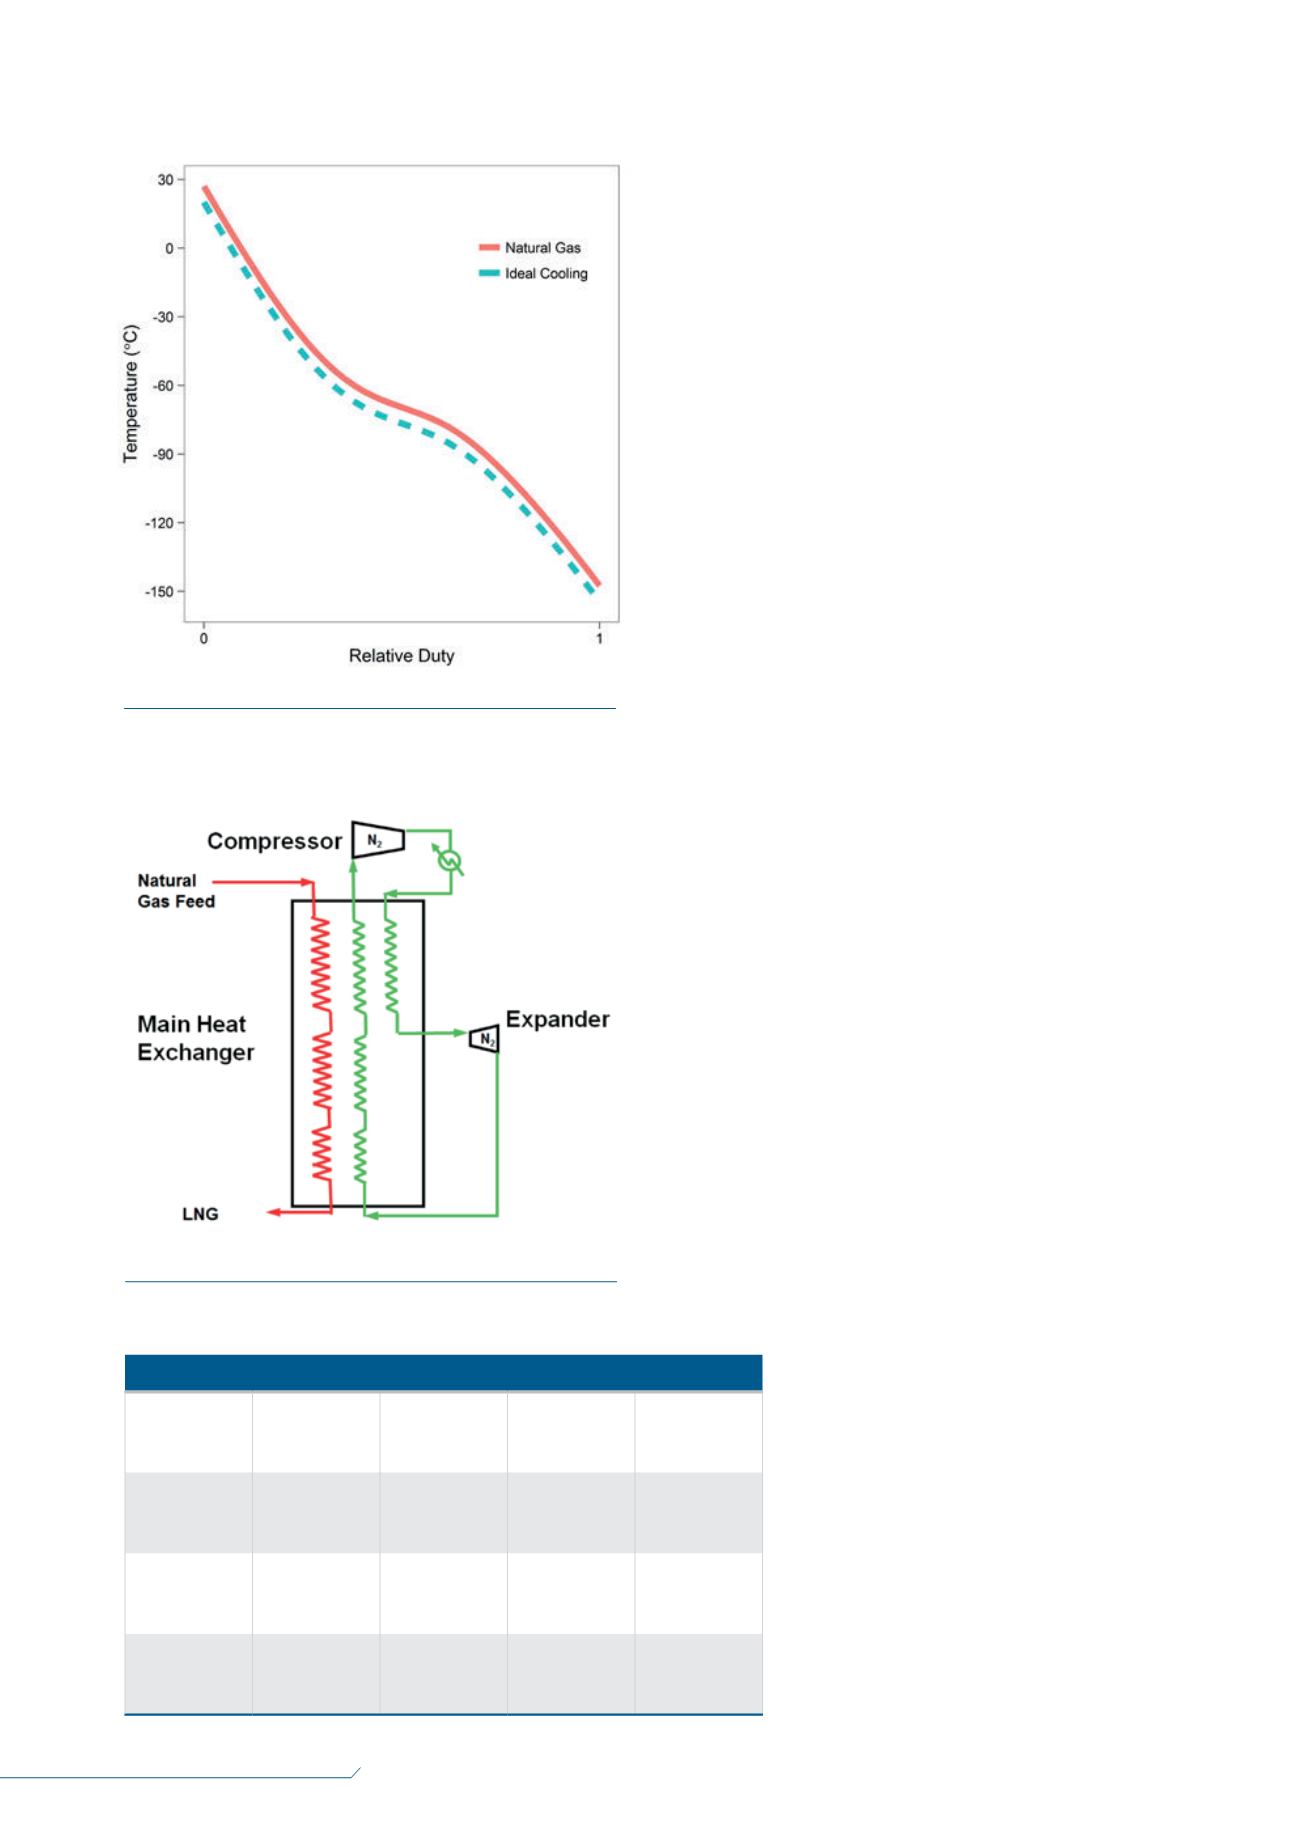
An ideal cooling curve is given in Figure 1. The horizontal
axis for this plot is the fractional amount of duty removed
from the natural gas. The vertical axis is the temperature
of the process stream. In Figure 1, the feed stream is
the hot side; the natural gas stream and its temperature
is shown by the red solid line. The refrigerant stream
temperature, which is the cold side of the main exchanger,
is shown by the blue dashed line.
For the process given in this example, the natural gas
enters the exchanger as a gas at ambient temperature. At
first, sensible heat is removed from the natural gas and
the resulting cooling curve is relatively straight and the
slope is proportional to the heat capacity of the feed gas.
After the dew point is reached, the slope flattens and the
feed liquefies as latent heat is removed from the natural
gas. Once liquefied, the change in natural gas
temperature increases as sensible heat is removed to
subcool the LNG.
The blue dashed line is an ideal cooling curve for an
ideal refrigerant system, or combination of systems. It is
considered as ideal because the shape of the curve closely
follows that of the natural gas cooling curve. The
temperature difference between these two curves are
related to the efficiency of the process. For a given
liquefaction process, the closer these curves are to each
other, the more efficiently refrigeration is supplied to the
natural gas, reducing the refrigerant compression power
requirement. Also, the closer these curves are to each
other, the more heat exchanger surface area is needed. For
a given process, the optimal heat exchange surface area
and compression power is determined by
the project specifics and the trade-off
between CAPEX and OPEX.
Cooling curves can also be used as an
aid in liquefaction cycle development by
identifying areas for improvement, and to
compare liquefaction cycles.
Nitrogen recycle
expander process
The nitrogen recycle expander process
is based on a Brayton refrigeration cycle,
which uses gaseous nitrogen as refrigerant.
The simplest nitrogen expander cycle has
only one expander, as shown in Figure 2.
In this process, nitrogen is compressed to
Table 1.
Air Products’ natural gas liquefaction processes for FLNG applications
Process
Relative
efficiency
FLNG train
capacity
(million tpy)
Type of
refrigerant
Feature
AP-DMR
1
3
–
4
Boiling
hydrocarbon
mixture
High capacity
AP-SMR
0.88
<2
Boiling
hydrocarbon
mixture
Simple layout
AP-N
0.72
<2
Gaseous N
2
Non-flammable
refrigerant
Figure 1.
Ideal cooling curve.
Figure 2.
Standard nitrogen cycle.


