78
LNG
INDUSTRY
JULY
2016
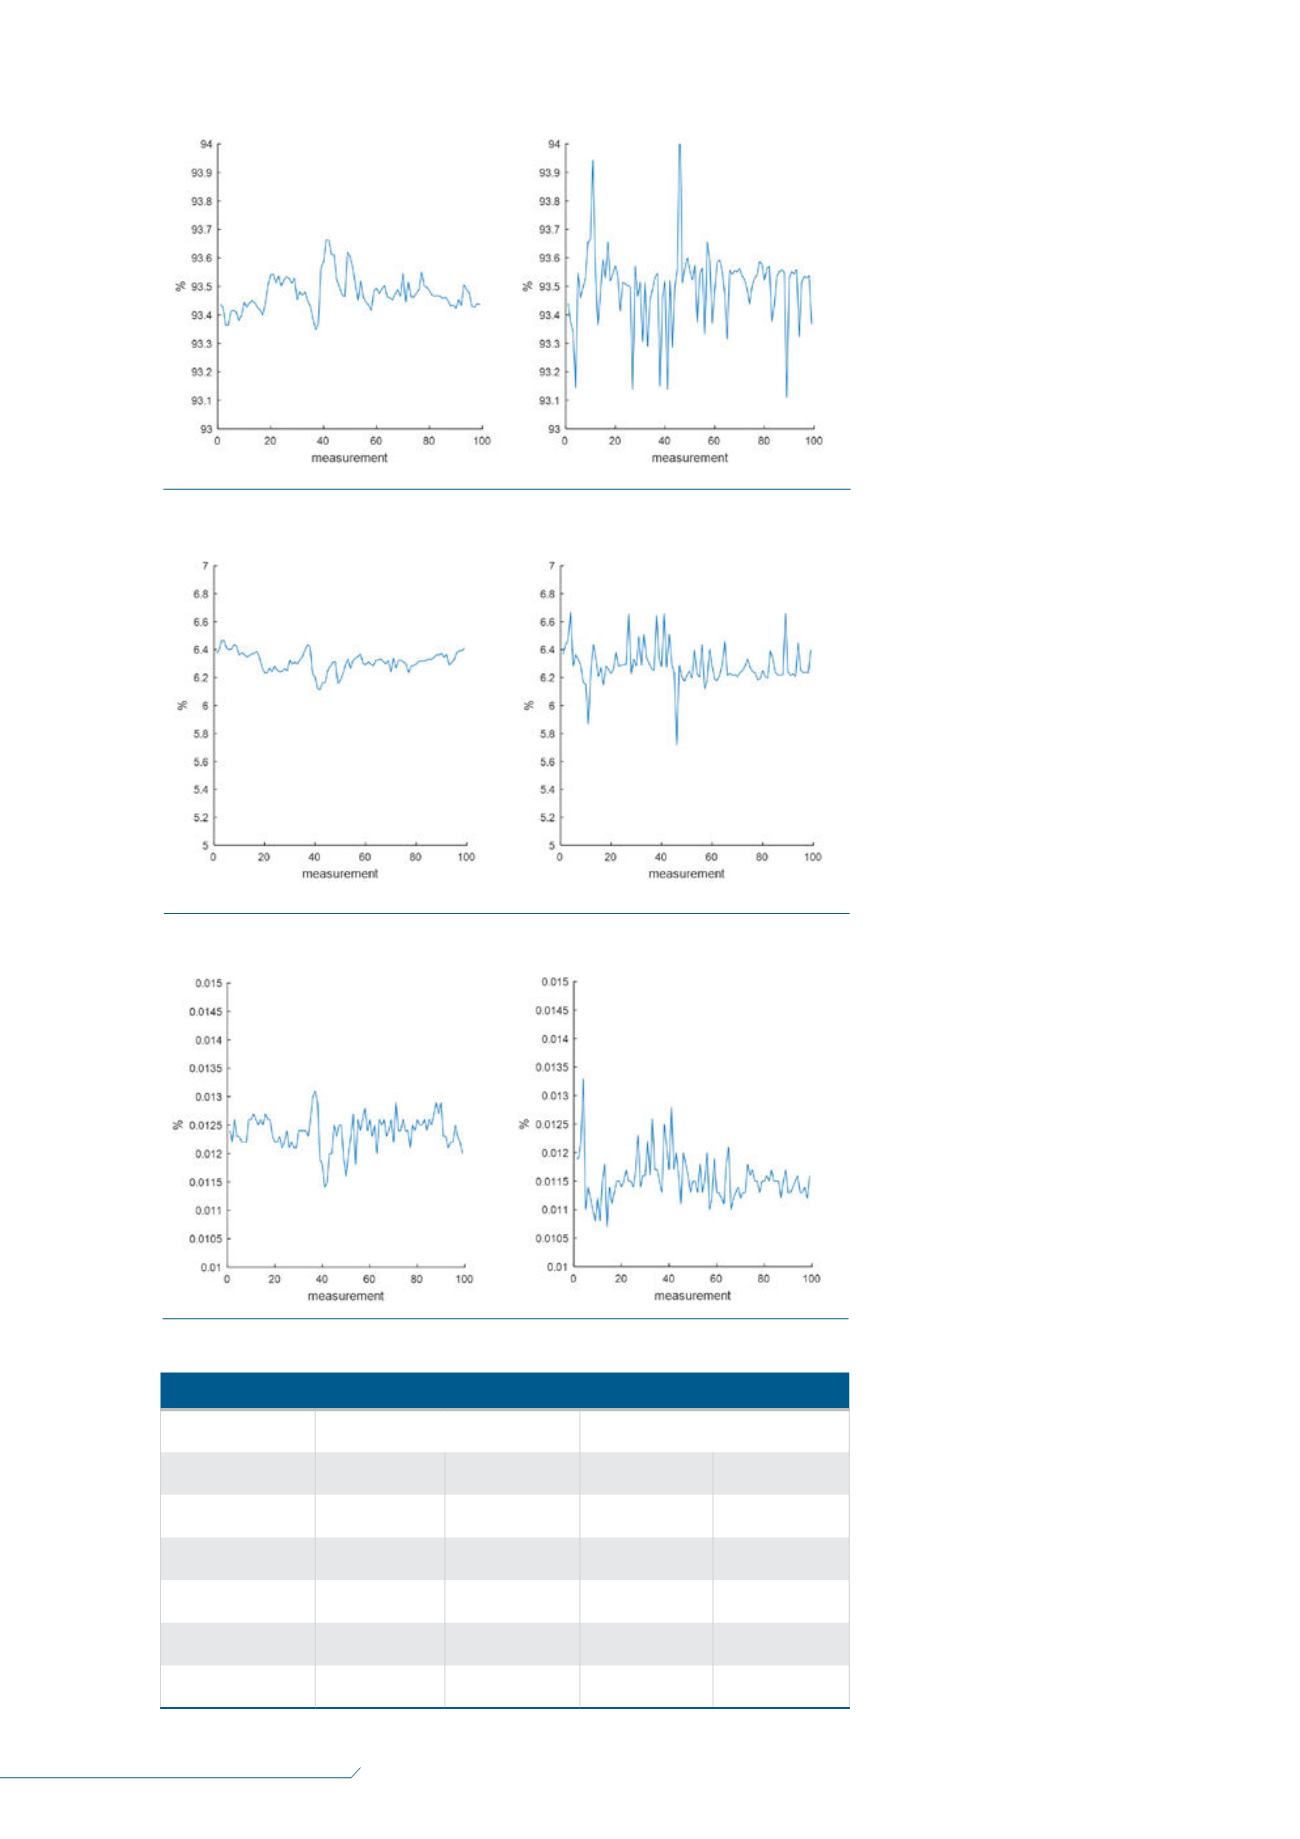
system one compared to system
two. The greater difference between
consecutive measurements can
be expressed as the line length.
In system two, the signal line
length is 4.2, 4.1, 1.6, 0.7, and 3.8
times longer for methane, ethane,
propane, nitrogen, and the GHV,
respectively. Another visual indicator
is the reported concentration ranges,
(highest – lowest) which are greater
for system two.
Normality testing was carried
out with a Lilliefors test, since the
true mean (
µ
) and deviation (
σ
) were
unknown.
10
The results are displayed
in Table 1. The data found using
system two was found to be not
normally distributed on the majority
of measured parameters. It was
decided to continue with the data
assuming abnormality for all
datasets. A normal distribution is
expected to be found in the datasets
by virtue of the following
arguments: the sample should be
homogeneous, fully mixed and of
constant quality. The systematic
error in the GC is normally
distributed and, in theory, it should
be possible to find this distribution in
the data. With both systems,
abnormally distributed results are
found, although system one
performs better on methane and
ethane.
The consequence of abnormal
distributions is that the standard
deviation (s) and mean ( ) cannot be
compared with the use of parametric
statistics, such as F-tests, Chi-tests,
or T-tests. However, they can be
compared with the use of
non-parametric statistics with less
statistical power. In this experiment,
the means were compared with the
use of a Wilcoxon sign rank test,
11
and variance with the use of
Levene’s robust test for equality of
variances.
12
These data are shown in
Table 2.
In Table 2, the average measured
concentrations on both systems is
shown. When compared in a
Wilcoxon test, these means are
found to be significantly different
from each other. Therefore, it makes
sense to note that the reported value
of ethane, propane, and the GHV is
higher on system one, whereas
methane and nitrogen have a higher
value on system two.
Table 1.
Results of Lilliefors test for normality
System one
System two
Dataset 1 (n=52) Dataset 2 (n=47) Dataset 1 (n=47) Dataset 2 (n=52)
Methane
Normal
Normal
Abnormal
Abnormal
Ethane
Normal
Normal
Abnormal
Abnormal
Propane
Abnormal
Normal
Abnormal
Abnormal
Nitrogen
Abnormal
Abnormal
Abnormal
Normal
GHV
Normal
Abnormal
Abnormal
Abnormal
Figure 4.
Combined methane signal for system one (left) and system two (right).
Figure 5.
Combined ethane signal for system one (left) and system two (right).
Figure 6.
Combined propane signal for system one (left) and system two (right).


