76
LNG
INDUSTRY
JULY
2016
curve, which means that the vapour could condense in a
different composition, depending on the vapour pressures. For
LNG, higher methane readings would be expected in the gas
than in the liquid, for the vapour pressure of
methane>ethane>propane.
4–6
The heat causing the LNG to pre-vaporise could come from
the vaporiser upstream that heats up the tubing, poor isolation,
or excess ambient heat. The heat influx is not necessarily enough
to fully vaporise the LNG, which would result in any variation of
two phase flow
7–9
and an inhomogeneous sample. Heat influx is
mainly caused by bad isolation on a sample line, which is easily
recognised by ice formation. This phenomena influences both the
composition and the homogeneity of the sample. One of the
solutions provided to address this problem is the probe-vaporiser
set-up. These kinds of vaporisers are directly connected to the
probe that is installed in the subcooled process liquid. An
example is shown in Figure 2. Noticeably, there is no sample line
for the liquid, reducing the opportunity for pre-vaporisation.
Partial vaporisation takes place inside of the vaporiser and
has the same effect as pre-vaporisation. Incomplete boiling
generates a gas with a different composition than the liquid. This
could be caused by a bad vaporiser design, insufficient heat
capacity, dead volume, or incorrect flow settings. During the
vaporisation of methane, the volume expands by a factor of 232
(1.013 bar at boiling point). If then immediately heated to 288 K, it
expands by a factor of 621. Pressure regulators reduce the flow
depending on the output pressure. The increase in volume
creates pressure that could stop the flow in the vaporising
pressure regulator. This situation maintains partial vaporisation
and heat flux upstream.
The analytical result of pre and partial vaporisation is a loss
in sample homogeneity and representability, expressed as
precision and accuracy, respectively. The influence on the
composition would lead to an increased measured
concentration of components with a higher vapour pressure, and
a decreased measured concentration of components with a
lower vapour pressure. Lastly, the calculated results, such as the
gross heating value (GHV), would change with the composition.
GHV would decrease in a systemwhere pre or partial
vaporisation is present.
Experimental details
In this case study, two commercially available LNG
probe-vaporising systems are compared based on the direct
analysis data. For an effective comparison, the vaporisers are
the only variables in the sampling system. Both systems use
the same accumulators, sample lines after vaporisation, and the
same gas chromatograph (GC). The used installation is shown
in Figure 3. Both probe-vaporisers were installed on the same
impact probe on the LNG transfer line.
The experiment tests the stability of the systems during
operation. All valves were fixed in position to prevent any
interference. Unfortunately, not all data could be used due to
commissioning works. Four datasets were selected (two for
each sampler) and combined, assuming the sample to be a
constant factor. The data is plotted for visual inspection.
Normality, means, and deviation were also calculated.
The data was collected during a real LNG ship-to-ship (STS)
transfer in the port of Dubai. Data was only used on the
condition that no works were being executed, parcel was
loading, and cooling down had finished. Data for measured
components CO
2
, iButane, nButane, NeoPentane, iPentane,
nPentene, and Hexane were negligible. This data was computed,
but did not render significant results due to the low
concentrations and were, therefore, omitted. The GHV was
computed by the GC. The influence of these components on the
GHV is included in the results.
Results and discussion
Figures 4 – 7 show the plotted results of the stability runs
for both systems for methane, ethane, propane and the
GHV. Optical inspection reveals that the signal is ‘calmer’ for
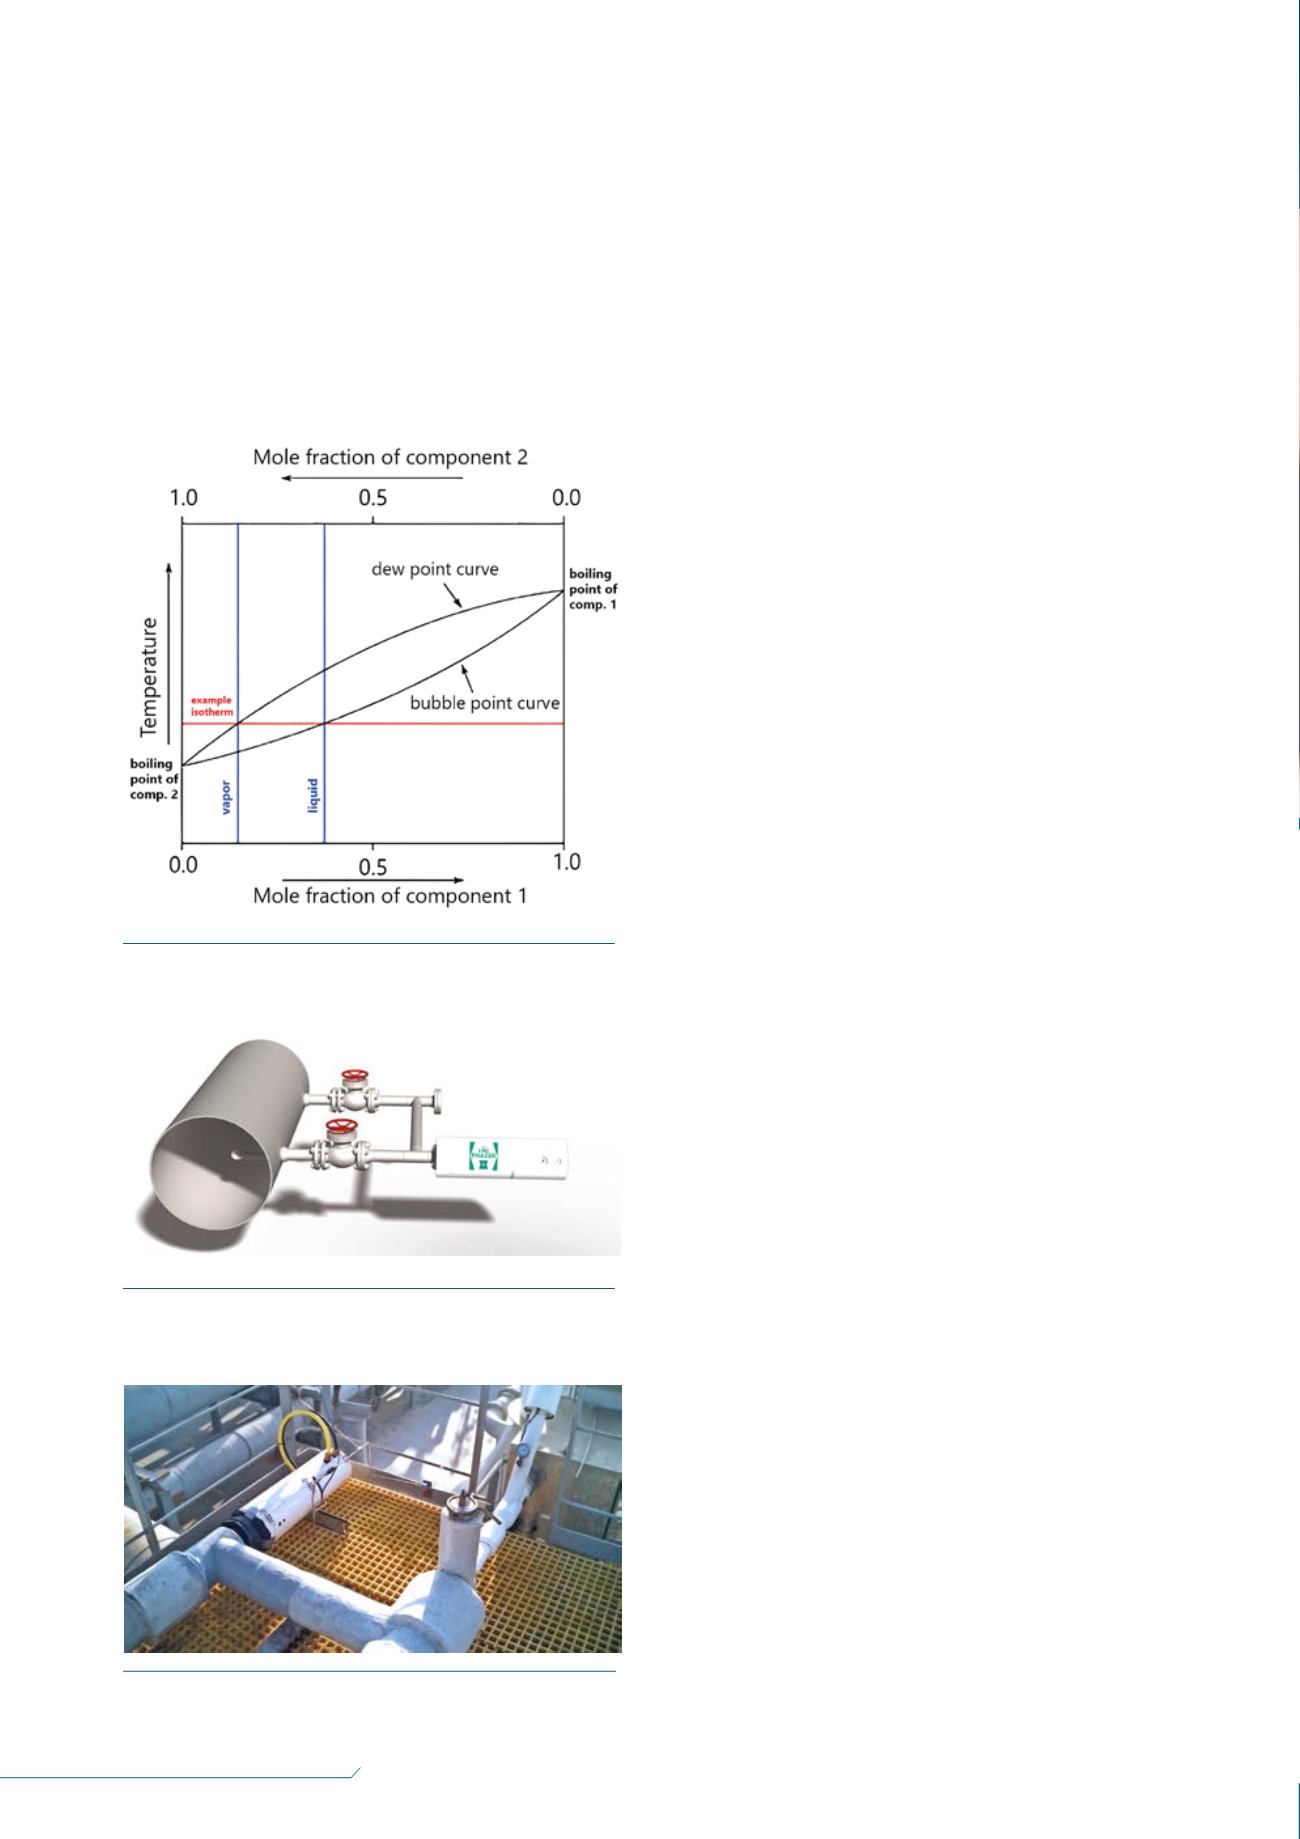
Figure 1.
Schematic showing the boiling point and bubble
point curve for a two component mixture.
Figure 3.
On-site photograph of the installed systems used
for the test.
Figure 2.
Typical installation of probe-vaporiser system,
ASaP Phazer, in process bypass.


