14
LNG
INDUSTRY
JULY
2016
However, emissions from the burning of fossil fuels have become
an increasingly important consideration in recent decades. Climate
change has emerged as key policy issue and, consequently, natural
gas is seen by many as necessary to support the transition to low
carbon energy. Proven to emit half of the greenhouse gases (GHG)
of coal, natural gas provides a mechanism to rapidly reduce
emissions and will see the highest fossil fuel demand growth to
2040. In 2015, the COP21 agreement outlined a clear roadmap to
the reduction of GHG emissions. This is expected to be a key driver
of changes to energy policy and growth in gas use. Beyond
environmental concerns, seasonal gas demand is also a clear driver
of LNG inWestern Europe, Latin America and theMiddle East. In
these regions, rising LNG demand is often due to declining local gas
production and not necessarily overall gas demand growth.
Globally, many basins with relatively low extraction costs have
matured. Consequently, exploration and production (E&P)
companies have been forced to develop higher cost plays, notably
deepwater, heavy oil and oil sands. Conversely, the gas market has
enjoyed a period of booming production underpinned by the advent
of shale gas in North America and coal bedmethane (CBM). This
previously stranded gas is now being transported to consumers via
LNG technology.
A combination of plummeting oil prices and a sharp fall in the
economic growth profiles of many Asian countries has, in recent
months, caused the LNG spot price to fall substantially. Asia is a key
region of demand growth, yet pricing has struggled. In April 2016,
Japan’s LNG spot price averaged US$7.75/million Btu – a 24%
decline compared to the same period 12months prior. Sustained
low oil price remains a concern for the LNGmarket, as most LNG
contracts are linked to oil price. Furthermore, various LNG
developments are vulnerable to capital constraints from the decline
in oil price, given that liquefaction projects are very capital intensive.
Market overview
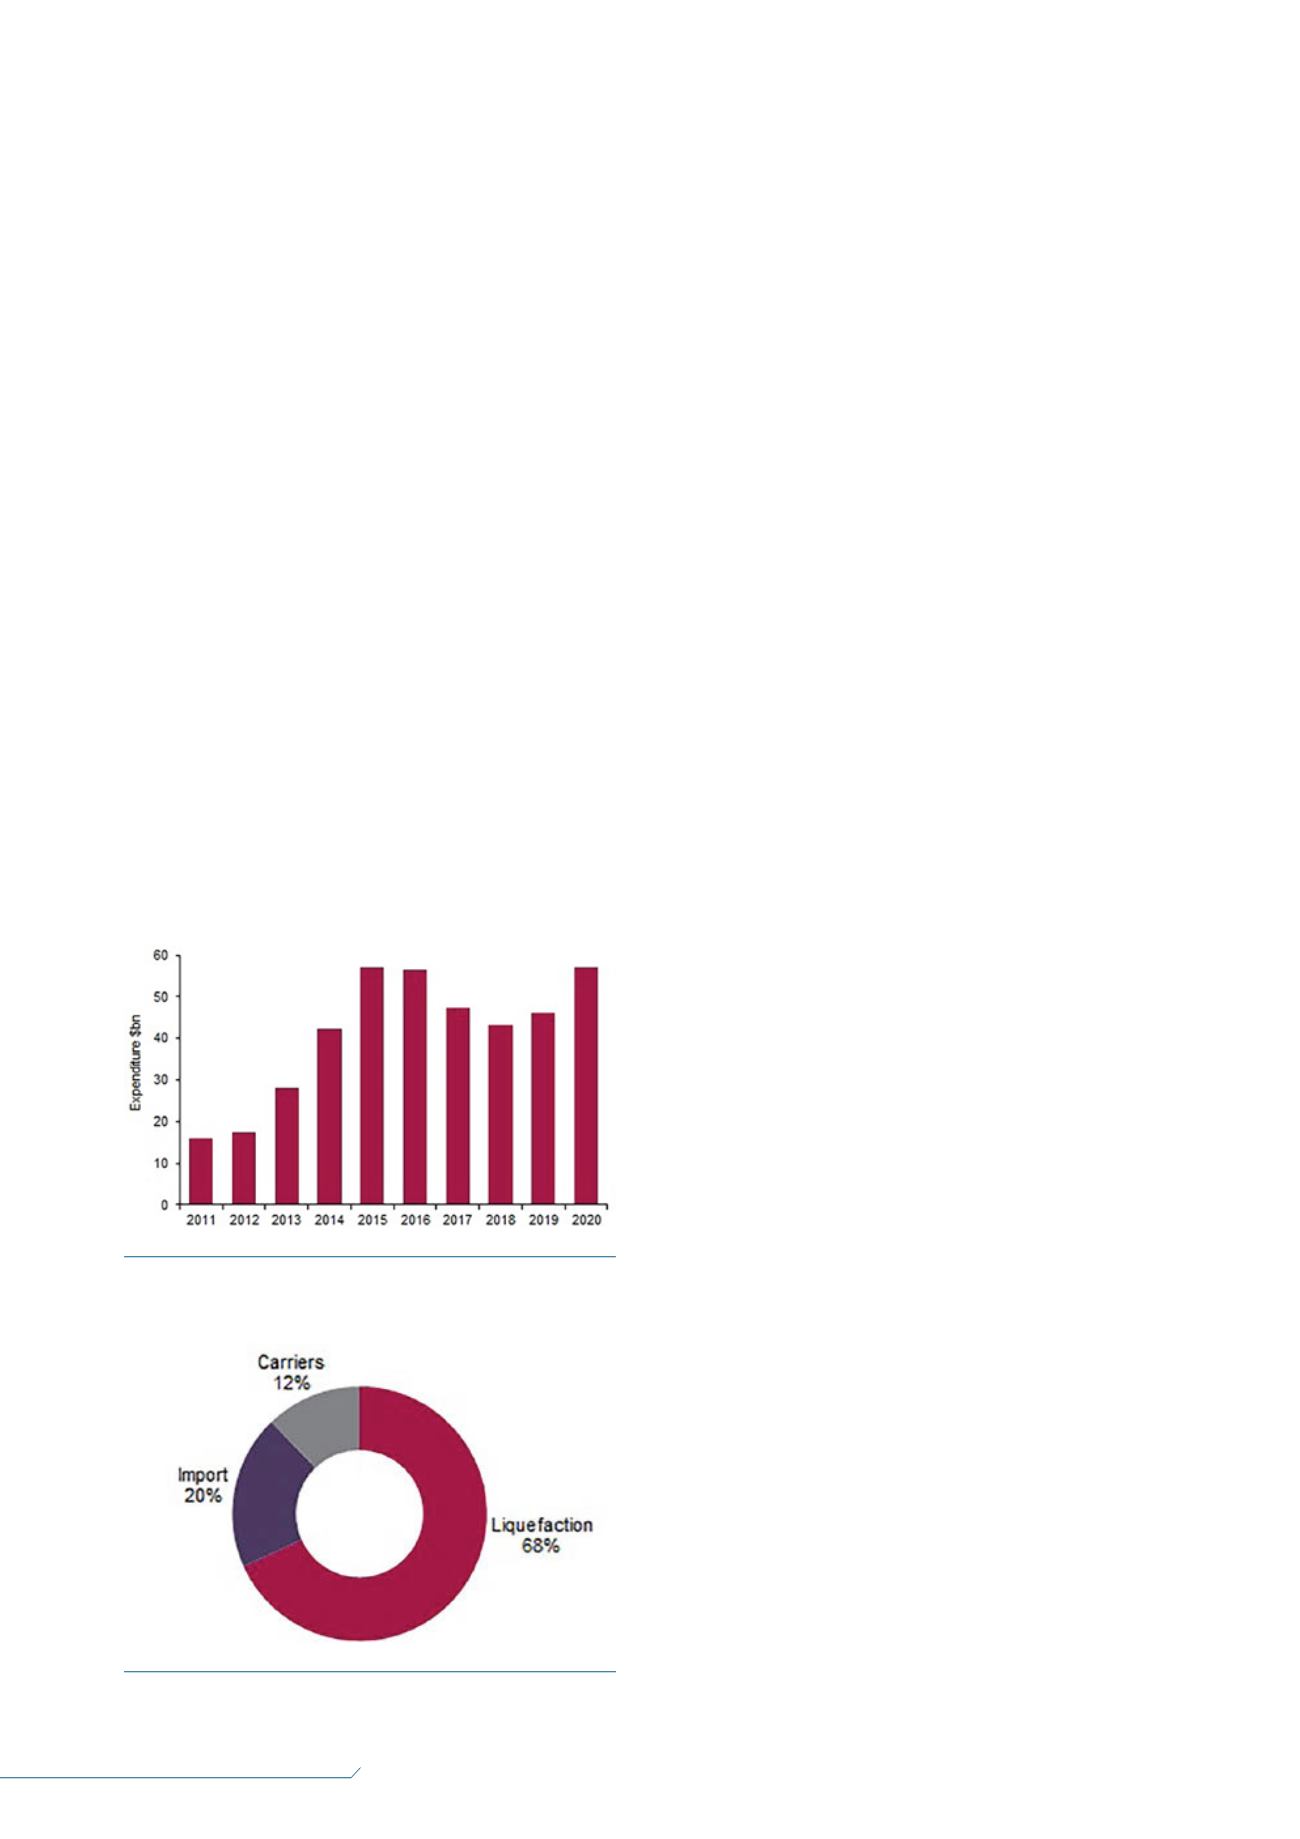
CAPEX on LNG facilities has been predominantly driven by large
liquefaction facilities in Australia over the 2011 – 2015 period. Over
the next five years, CAPEXwill be driven by numerous projects in
North America and a handful of projects in Africa. Owing to the
number of projects that are currently under construction and those
approaching Final Investment Decision (FID), Douglas-Westwood
(DW) forecasts expenditure on global LNG facilities to total
US$250 billion between 2016 and 2020. This represents a 56%
increase compared to the preceding five year period.
Over the forecast period, all regions are expected to experience
steady growth in CAPEX, with the exception of Australasia, where
the LNG construction boom looks to be coming to an end. Several
Australianmega-projects, such as Gorgon LNG, Ichthys LNG and
Wheatstone LNG, are expected to be fully operational by 2018.
Furthermore, FID has not been taken on any Australian LNG project
since 2012. With commodity prices depressed, future LNG projects
in Australia are uncertain. Those currently in the front end
engineering design (FEED) stage are struggling tomake economic
sense in the low price environment.
Over the next five years, there will be a significant shift in
expenditure to North America for the construction of new LNG
facilities. Despite the long-winded approval process in the US and
Canada, the North American region will account for 24%of total
expenditure on LNG facilities over the 2016 – 2020 period. Projects
such as Sabine Pass LNG Train 1 – 4, Freeport LNG Train 1 – 3,
Cameron LNG Train 1 – 3 and Bear Head LNGwill drive expenditure
in the region over the forecast period. By far the largest proportion
of global LNG expenditure will be attributed to liquefaction projects.
This accounts for 68%of spend over the forecast period. Import
facilities will constitute 20%, whilst spend on LNG carriers will
represent 12%of total expenditure between 2016 and 2020. It is
pertinent to state that the Asian shipyards are expected to service
nearly all carrier shipbuilding contracts over the next five years.
Africa in focus
During the preceding five year period, activity on liquefaction
developments was limited, with a handful of projects, such as
the Skikda GL1K Phase 2 Replacement, Angola LNG Train 1 and
Gassi Touil (GL3Z LNG), all becoming operational over this time.
However, Angola LNGwas temporarily shut down in 2014 after
a ruptured pipe. The facility has a capacity of 5.2million tpy and
represents a significant project for the Angolan energy sector.
However, the facility has experienced significant delays and
production only resumed in June 2016.
Over the next five year period, DW forecasts expenditure on
LNG facilities in Africa to grow at 103%CAGR, with spend totalling
US$21 billion – an overall increase on the previous five year period
of 26%. Despite delays, such as to the seventh train in the
Bonny Island project, Engie’s Cameroon LNG project and the
Ethiopia –Djibouti LNG project will account for themajority of
expenditure in the near-term. The significant growth in CAPEX seen
by the end of the forecast period is as a result of the
commencement of construction activity on the proposed
Afungi LNG Train 1 and 2. This project is expected to contribute a
total of 12million tpy of liquefaction capacity when completed.
However, despite progress made, with FEED studies already
completed, the absence of infrastructure, lack of skilled personnel
and regulatory uncertainties might cause delays to the
Figure 1.
Global LNG expenditure 2011 – 2020 (source:
Douglas-Westwood (DW), World LNG Market Forecast).
Figure 2.
Global expenditure by LNG facility type 2016 – 2020
(source: DW, World LNG Market Forecast).


