32
LNG
INDUSTRY
OCTOBER
2016
they improve their performance to match that of the
leading companies. This has resulted in cost savings for
many terminals. Table 2 shows average changes in cost
performance for the benchmarking group from 2012 to
2015. Overall, a significant decrease in total OPEX of
11% was observed, with a similar saving in maintenance
and a larger saving of 29% in functional support services
(health, safety, security, environment and quality (HSSEQ),
engineering and laboratory). Only in the area of operations
was there a minimal increase in cost performance during
this period, which may be expected given the ongoing
regulatory requirements for minimum manning levels in
this area, thereby limiting opportunities for cost reductions.
The aim of any terminal is to be strong in terms of both
efficiency and effectiveness. All companies want to
maximise the quality of their outputs, whilst optimising
cost and manpower levels. Thus performance in areas such
as health, safety, environment, integrity availability and
reliability all carry equal importance to operating
efficiently. The relative effectiveness and efficiency
performance of each of the benchmark terminals is shown
in Figure 3. The quadrants, depicted by median
performance levels, determine the strategy that each
terminal should adopt for improvement. The objective of
the benchmarker is to attain a leading position where both
effectiveness and efficiency performance are optimised
(upper right quadrant). Figure 3 also shows the
improvement journey of one terminal (Company B) from
2012 to 2015, as it learnt from the benchmarking and acted
upon the findings of the analysis to deploy improvement
projects and realise step changes to performance. During
this period, it achieved total cost savings of 20%, whilst
maintaining terminal availability and reliability at 100% and
halving the number of overdue work orders.
The benchmarking indicated that expenditure on
contractors at one terminal was particularly high. Acting on
the findings of the benchmarking, the company was able to
realise significant cost savings. It examined ways in which
its reliance on third party contractors could be reduced
through utilising its own staff wherever possible. It also
reviewed key contracts and established long-term
contracts with selected vendors, thereby reducing hourly
rates.
Another terminal discovered that the manpower time
spent on operations was well above many of the leading
terminals. It assembled a multifunctional improvement
team, including personnel from maintenance and safety
and identified more than 20 maintenance tasks that could
be conducted by operations staff. In so doing, it was able
to absorb over 1700 man-hours of maintenance time into
operations, which, in turn, not only realised a cost saving,
but also more effective completion of the tasks.
Maintenance efficiency was the focus for a third
terminal that achieved y/y improvements resulting in a 14%
improvement in manpower productivity over a 4-year
period, through the introduction of a totally revised
maintenance strategy. An organisation was put in place,
centred around an asset management philosophy
compliant with ISO55001 and with a risk-based approach.
The resulting increased focus on maintenance
programming, supervising and quality control enabled the
company to execute the work with fewer resources.
It is not only about cost
Whilst attaining a cost leadership position is an objective
of most terminal operators, it is also essential to ensure
that performance is as effective as possible. One of the
benchmarked terminals discovered that its maintenance
planning was not as effective as its peers’. In order to
gain better control, it introduced some of the KPIs used
in the benchmarking into its maintenance management
system and, as a consequence, was able to measure its
maintenance backlog more accurately, resulting in more
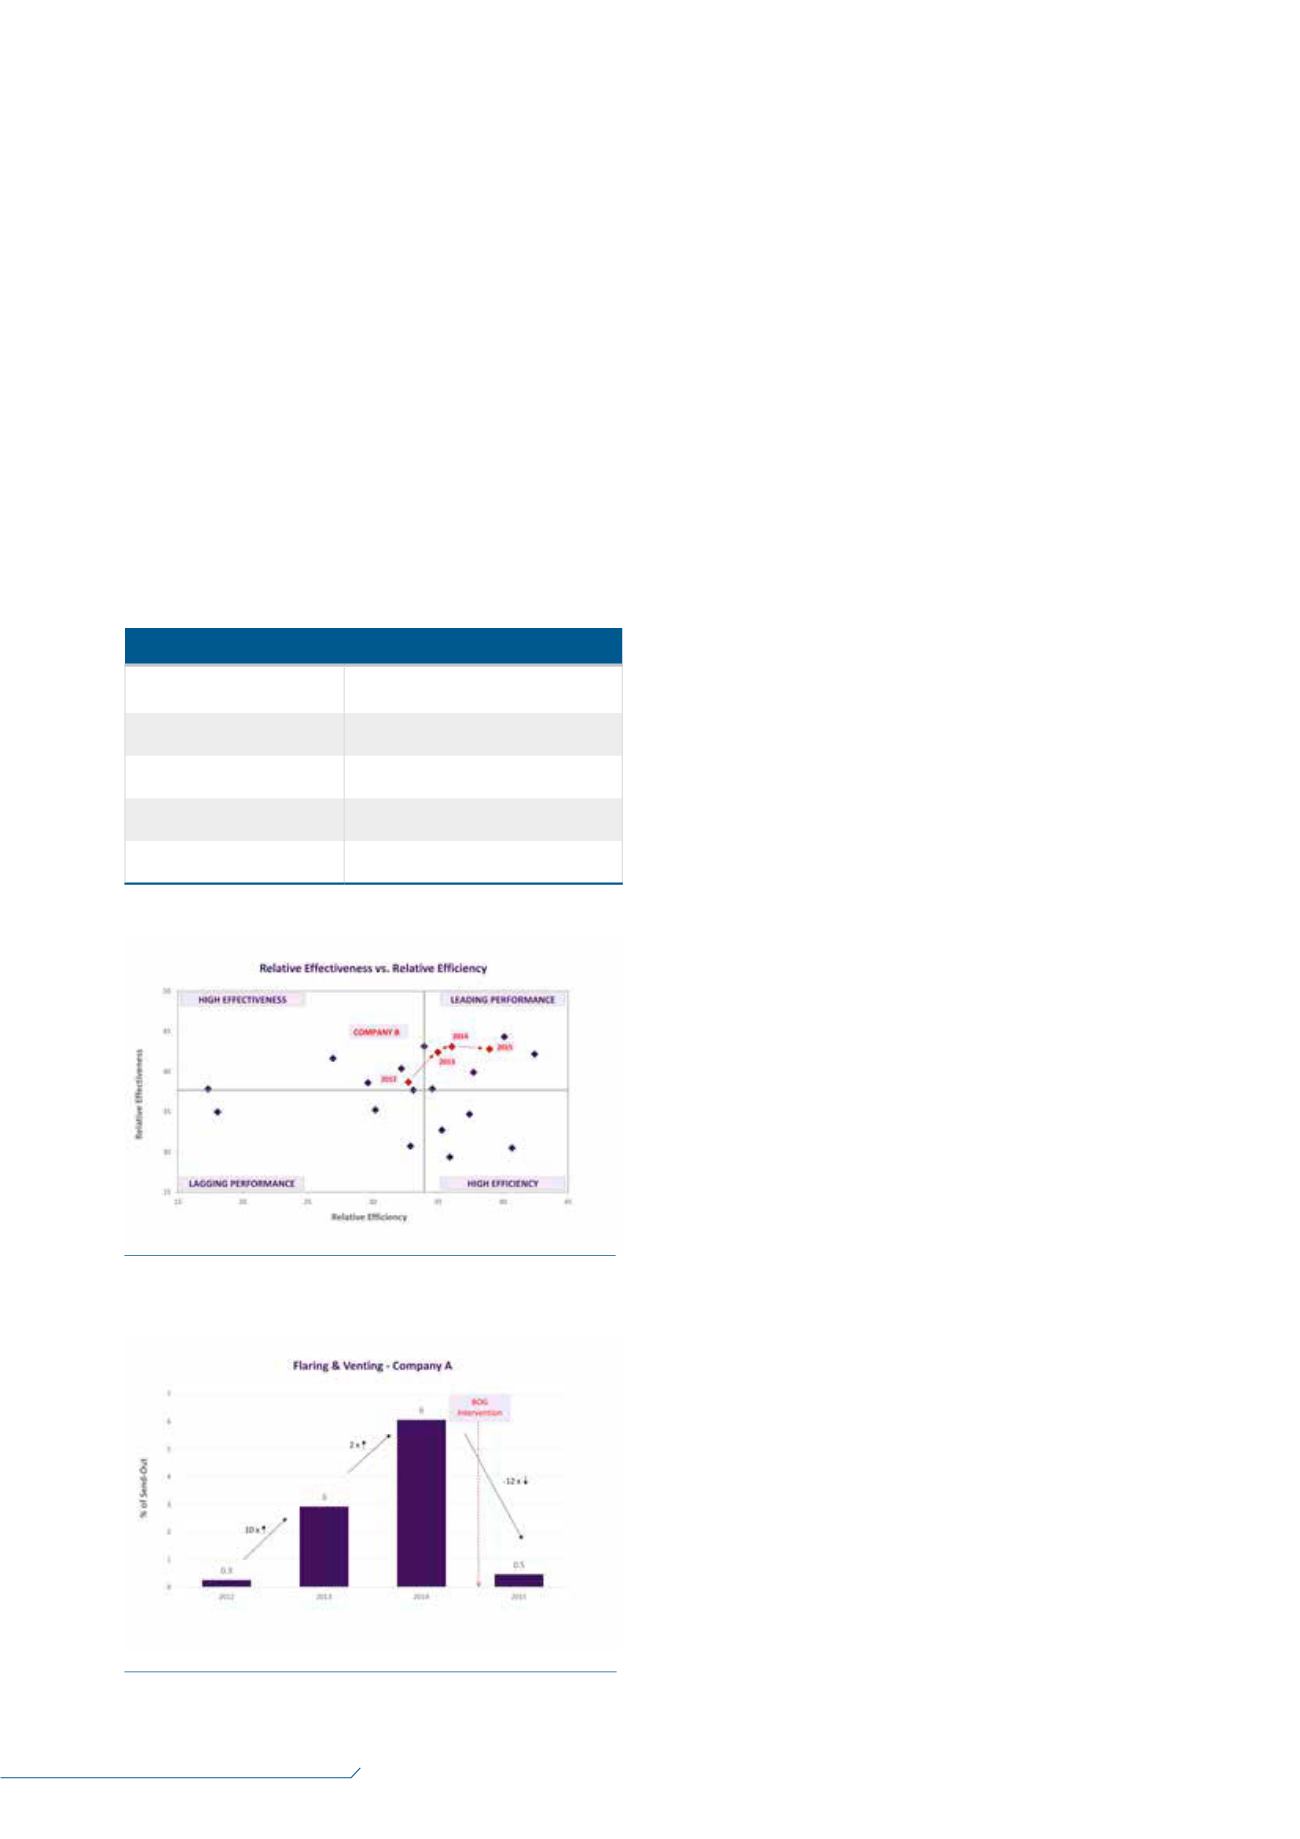
accurate maintenance planning compliance. Another
terminal recognised that it had increasing levels of flaring
y/y (Figure 4) as a result of increased boil-off gas (BOG)
caused by minimal send-out levels. Through the sharing of
best practices amongst the group, the company was able
to learn from the other benchmarkers to identify technical
improvements that could be adapted and adopted at
Table 2.
Performance averages for the benchmarking group
Peformance area
Change in performance
(2012
–
2015)
Terminal total costs
11% decrease
Operations costs
3% increase
Maintenance costs
11% decrease
Functional support costs
29% decrease
Figure 3.
Comparing terminal efficiency and effectiveness.
Figure 4.
Patterns in flaring and venting at one terminal
from 2012 to 2015.


