30
LNG
INDUSTRY
OCTOBER
2016
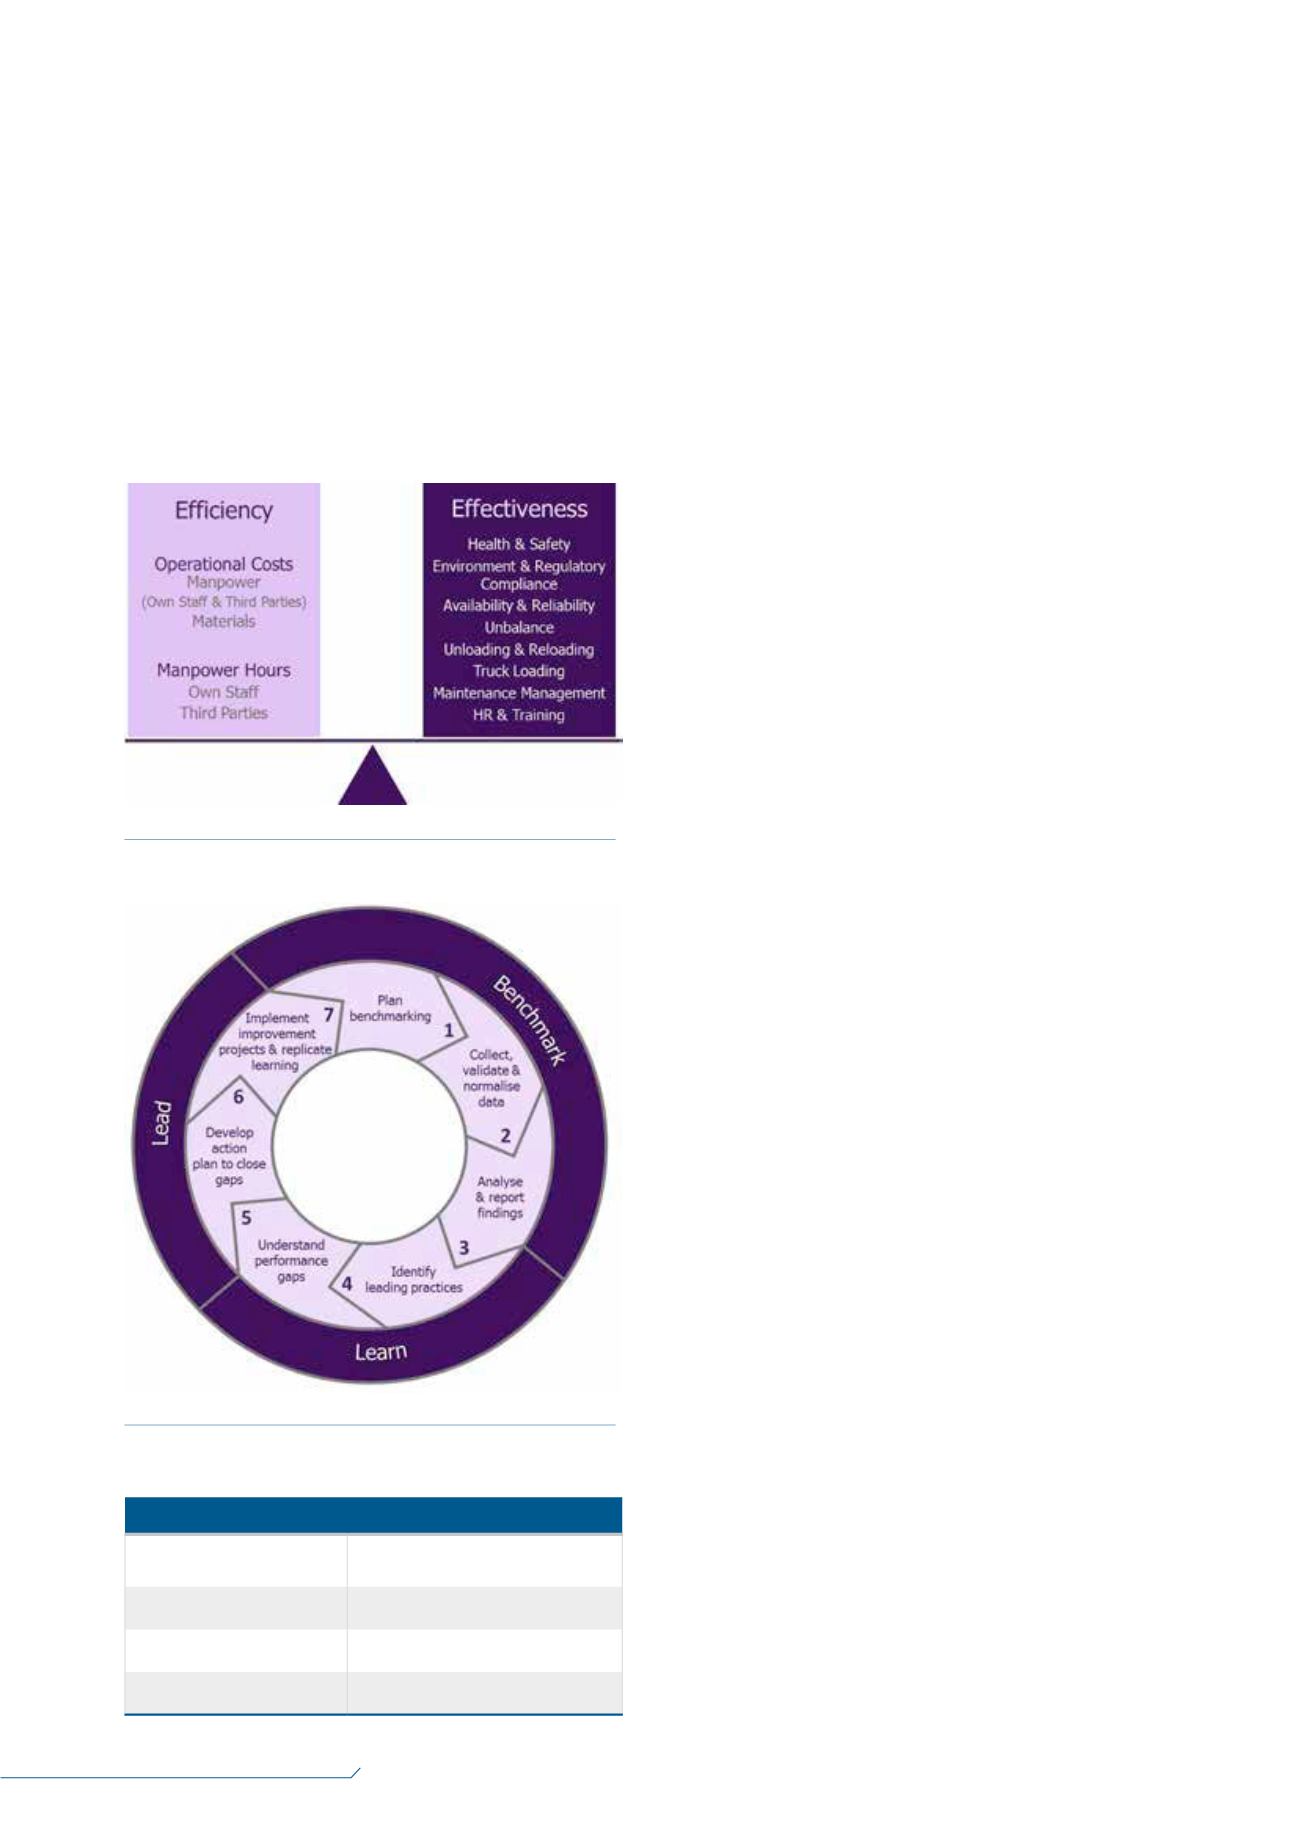
The scope of the benchmarking includes a detailed
analysis of both the efficiency and effectiveness of terminal
operations, maintenance and related support functions
(Figure 1). Efficiency considers OPEX for manpower and
materials, as well as manpower time expended. Costs and
manpower time for each terminal are analysed for each
performance-driving area, including the following:
Operations.
Maintenance.
Functional support services.
Energy consumption.
Effectiveness is determined by a suite of KPIs reflecting
the quality of outputs, including health, safety, environment,
availability, reliability, integrity and maintenance
management, etc.
Performance analyses are made between terminals and
performance gaps determined. The process follows the
Juran Benchmarking Cycle
©
(Figure 2), which provides a
robust, systematic approach, commencing with
benchmarking planning, through data collection, validation,
analysis and reporting. The output of this analysis enables
improvement opportunities to be targeted, whilst
formulating appropriate deployment activities in order to
implement change and realise improvements in
performance.
Like-for-like comparison
Central to effective benchmarking is the need to be able to
compare different processes, functions, or, as in this case,
LNG receiving terminals on a like-for-like basis. No two
terminals are the same, so it is essential that an appropriate
methodology is used to account for the differences so that
valid performance comparisons can be made. If this is not
achieved, then any subsequent analysis is of limited value.
To enable this, it is necessary to normalise performance data
in a way that allows like-for-like comparisons.
One approach often seen is to use volumes of send-out
gas or terminal capacity as normalising factors. However,
these are crude approaches and there is no correlation
between them and either expenditure or manpower time.
Therefore, a unique and innovative methodology was
incorporated that enabled like-for-like comparisons of costs
and manpower levels between terminals of differing size
and design – the Juran Complexity Factor
®
, which is based
upon the technical complexity of a terminal and the
corresponding effort required to operate and maintain it. The
methodology has an excellent correlation with both OPEX
and manpower time and, therefore, provides a robust
methodology for enabling direct comparisons of different
terminals.
Operational context
Global changes in the LNG market have resulted in a marked
impact on the operating environment of European LNG
receiving terminals during the four years that the consortium
has been working together. Table 1 illustrates the average
changes in terminal utilisation, send-out volumes and
vessels unloaded between 2012 and 2015, based upon data
obtained from the participating terminals. The reduction
in utilisation has seen natural gas send-out volumes fall to
minimum levels, bringing with it significant challenges both
technically and commercially. All terminals recognised the
need to minimise cost, whilst adjusting to new operational
envelopes with minimum delivery, which became a key
focus for the consortium in the initial years.
Rising to the challenge
The participating terminals have used the benchmarking
to support them as they strive to meet the increasing
challenges of operating during these difficult times. The
comparative measurement of efficiency conducted in the
benchmarking enabled the identification of cost gaps and
savings potential for each participating terminal, should
Figure 1.
The benchmarking scope.
Figure 2.
The Juran Benchmarking Cycle
©
.
Table 1.
Performance averages for the benchmarking group
Peformance area
Change in performance
(2012
–
2015)
Terminal utilisation
38% decrease
Terminal send out
44% decrease
Number of vessels unloaded 25% decrease


